
Introduction: The Product Experience
The user sits at the center of the product experience, and their sentiment towards the product depends on a variety of factors.
1. Visual (how does it look)
2. Tactile (how does it feel)
3. Aural (how does it sound)
It might be easy to understand a sleek visual aesthetic, but how would you pursue a sleek sound? Or how can brand iconography extend to create recognizable sounds that stand out like Netflix’s “tudum”? Ultimately, products don’t exist in a vacuum, and the context in which the product is used can change the perception of its sound.
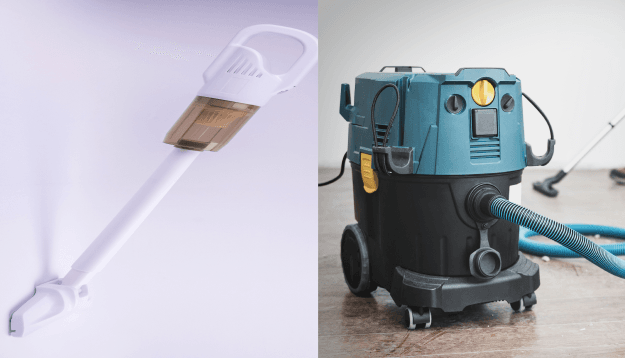
Think about a home-use vacuum versus one for an industrial environment
The best feedback for how a product should sound comes directly from the users, through listening panels. Quantitative understanding then comes from analyzing their responses and combining them with rigorous noise audits to understand the sources of noise and how to change them. At Acentech, we consider acoustics a blend of art and science, and it is impossible to rely on either domain alone to craft successful product sound designs.
Below are five small previews of the sounds of different parts of a vacuum, each isolated and recorded at Acentech. These recordings were later modified and combined in different ways to create variations of how the vacuum might sound with different design changes. Listen to the sound of the vacuum parts separately and all together in preparation for the interactive module later in the article.
Listen below:
Complete Original Vacuum Cleaner Sound
Motor Sound (w/. cooling fan) (M)
Airflow Sound (A)
Agitator (Beater) Sound (B)
Suction Fan Blade Passage Tone (S)
Investigation: Noise Audits
A single product has many components that contribute to its overall noise character. These sources might include noise radiated directly from a component under normal operation, such as the whine of a motor or the tonal noise associated with a fan’s blade passage frequency. Other sounds are only produced when the components are interconnected, like structure-borne noise from the same motor connected to the body of the product, or noise from gear teeth meshing together. Other interactions may be dependent on non-direct connections, such as airflow noise.
As noise control engineers, we conduct “noise audits” to break down the sound into as many principal components as possible. We measure individual sources in a reverberant test room, and when the source object can’t be isolated (by, for example, operating it alone under representative loading conditions, or by signal processing means), we use a “, where other sources are attenuated with passive enclosures, wrappings, or silencers. Sound intensity probes or acoustic cameras can also be used sometimes to get more detailed estimates of source contributions.
Once the sources have been identified and quantified, they can be rank-ordered to prioritize the development of noise reduction for the loudest components. This ensures that time isn’t spent attempting to treat components that aren’t significant contributors. From there, a new composite sound can be rendered, mixing various components at different levels to achieve one possible version of a desired product sound. One option might be a balanced design, where each major source has roughly the same contribution, or an unbalanced design, if one component is preferred to be the principal sound for the product. Making these adjustments purely in terms of the overall A-weighted sound level can be an effective way to reduce the noise, but they don’t necessarily represent the user’s perception. Here, we turn to the users to more effectively home in on a design.
Understanding User Experience: Sound Quality Jury Studies
The sound a product produces can contribute to a person’s overall perception of the product or brand. Users may judge the product based on the overall impression conveyed by the sound or the acceptability of the sound in the context of its use (including whether the person is a user of the product or a bystander). Companies are often faced with negative reactions to the sound of their products and may be uncertain as to how to improve the sound quality to increase the general acceptance of their products. These issues, coupled with the need for manufacturers to develop high-end and international markets, have made sound quality (SQ) an important product attribute.
Acentech designs and carries out unique and customized forms of SQ jury studies that are used to evaluate and document the subjective impressions of a range of “what-if” sounds produced by a product. We then provide guidance on how to modify the product to improve its sound by a targeted amount, in agreement with the jury study outcome.
Many dimensions affect the acceptability of a product’s sound, or even the perceived build quality of the product, beyond the raw decibels. Some of these include:
- Strength/magnitude (dBA, loudness, speech interference)
- Annoyance value (noisiness, roughness, sharpness, Perceived Noise (PN) dB, tonal prominence – bothersome aspects of the sound)
- Amenity value (regularity, harmonicity, pleasing aspects)
- Information content (identification, performance, condition of the product, appropriateness of the sound relative to context)

Some aspects of sound quality can be measured, while others rely on user input, which provides valuable context related to expectations based on personal experience and environment. Sound quality is ultimately subjective, necessitating the collection of both sound-related and non-sound-related information from users. One approach is using focus groups to assess the importance of sound alongside other product attributes and jury studies involving actual consumers to gauge sound preferences.
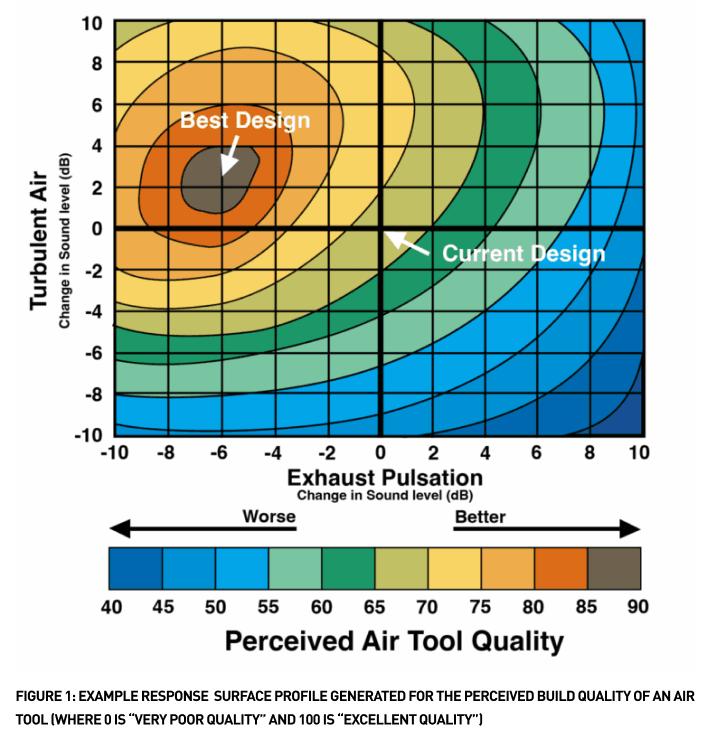
As sound designers, we can modify recorded product sounds to create various sound profiles that are feasible for implementation. By analyzing user feedback across these options, we can generate response surface profiles to identify paths for enhancing sound quality with comparable user satisfaction. This analysis can also reveal how much extra consumers might be willing to pay for improved sound quality.
Sound Quality Jury Study Design: Example Process
Several factors go into designing a jury test for sound, from choosing the basic study type (magnitude estimation, semantic differentials, paired comparisons, etc.) to deciding on values for a number of parameters that affect logistics, the kind of information obtained, and the statistical confidence associated with that information. All of these require careful consideration well before the listening panel convenes.
To illustrate this process, we can review the elements needed for an example magnitude estimation study, in which jurors were asked to provide numerical ratings on a set of “virtual” vacuum cleaners they listened to. For this particular study, the client wanted us to determine ways to modify their vacuum’s sound to make it sound more “acceptable” while not diminishing its perceived power.
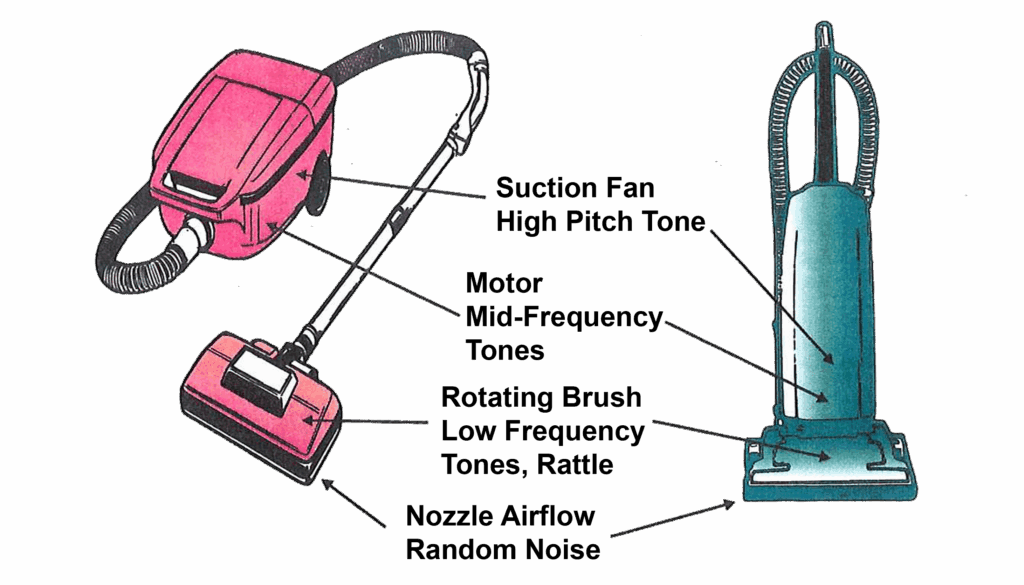
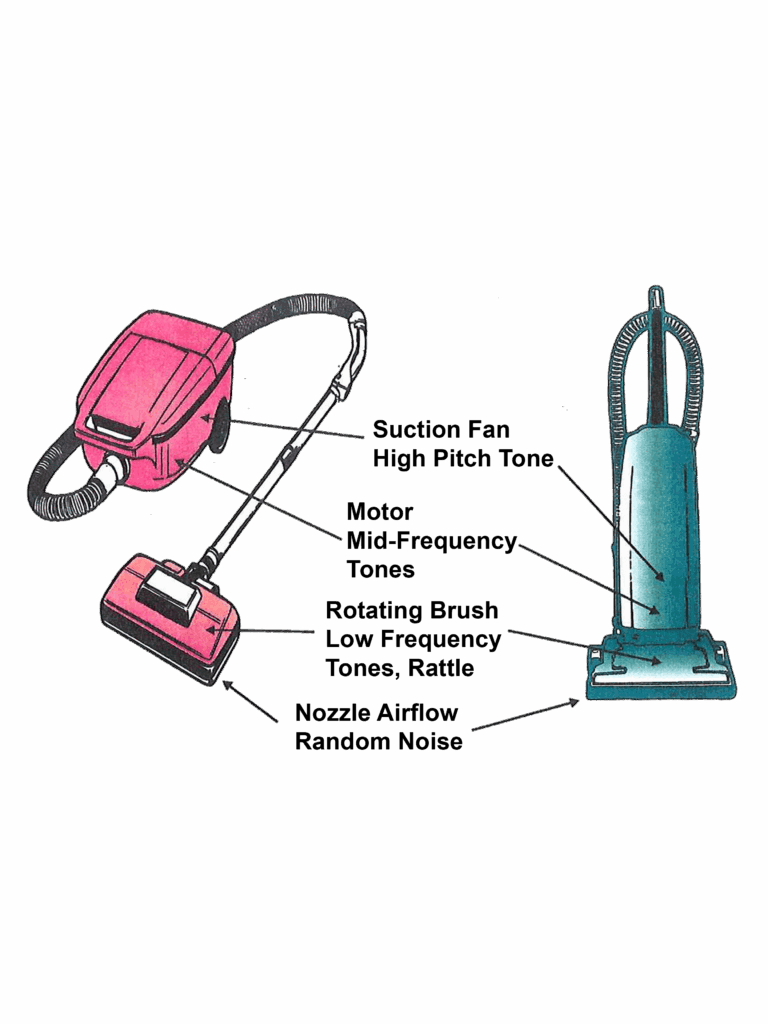
Figure 2: Main components responsible for producing sounds in canister and upright vacuum cleaners
The basic concept for this type of study draws on the food/flavor and perfume industries, where a common goal is to determine an optimal mix of ingredients to enhance the user experience. In our case, the “ingredients” are the sounds produced by the different components making up the product, and the “enjoyment” is reflected by ratings on subjective attributes such as “acceptability” and “power” or “effectiveness”, as conveyed by the sound of the product. For vacuum cleaners, we can think of there being, as denoted in Figure 2, each producing its own unique sound:
- The Suction Fan: High Pitch Tone
- The Motor: Mid-Frequency Tones
- Rotating Brush: Low Frequency Tones and Possible Rattle
- Nozzle Airflow: Random Noise
Exhibit 1 | Interactive Listening Module
Below are the sounds of six different “what-if” vacuum cleaners, each having the sounds of the different parts of the vacuum modified to be louder, quieter, or unchanged. Such changes were made and tracked by changing the overall sound level of the part by 4 decibels at a time, represented as one “step”. (1 Step = 4 Decibels)
Listen to the variations below, then vote on the one you find most acceptable for the sound of a vacuum cleaner.
Variation A
Variation B
Variation C
Variation D
Variation E
Variation F
Variation A: Variables M, B, and S were increased by 1 step and variable A was decreased by 1 step.
Variation B: Variables A and S were increased by 1 step and variables M and B were decreased by 1 step.
Variation C: Variable M was decreased by 2 steps.
Variation D: No variables were changed.
Variation E: Variable A was increased by 2 steps.
Variation F: Variable M was increased by 1 step and variables A,B, and S were decreased by one step.
The range of component sounds and the number of combinations needed to span the design space are set by a statistical Design-of-Experiments (DOE) framework. A Central Composite design is commonly used, though Simplex and Box-Behnken designs are also viable. DOE type, number of component sounds, number of operating modes, number of subjective attributes, desired confidence level, and the choice of 1st- or 2nd-order regression (including interaction terms) all dictate the required jury size and, together with sound-sample duration, determine total session length. Sound samples should be kept short (about 5–10 seconds) due to limits in “sonic memory.”
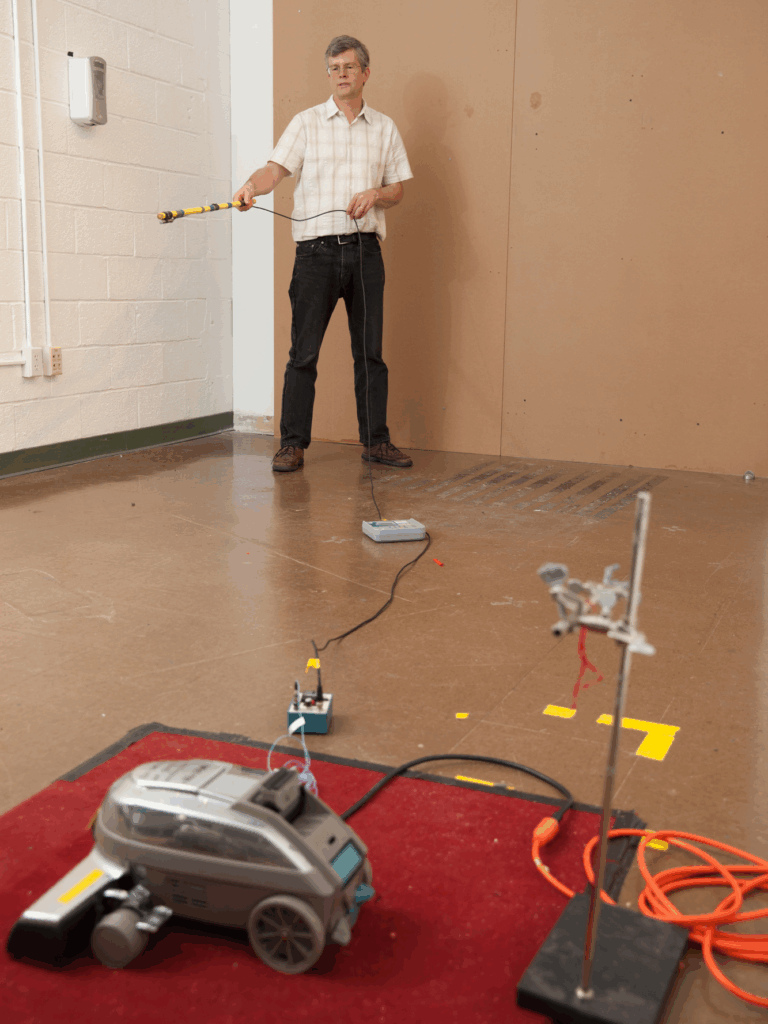
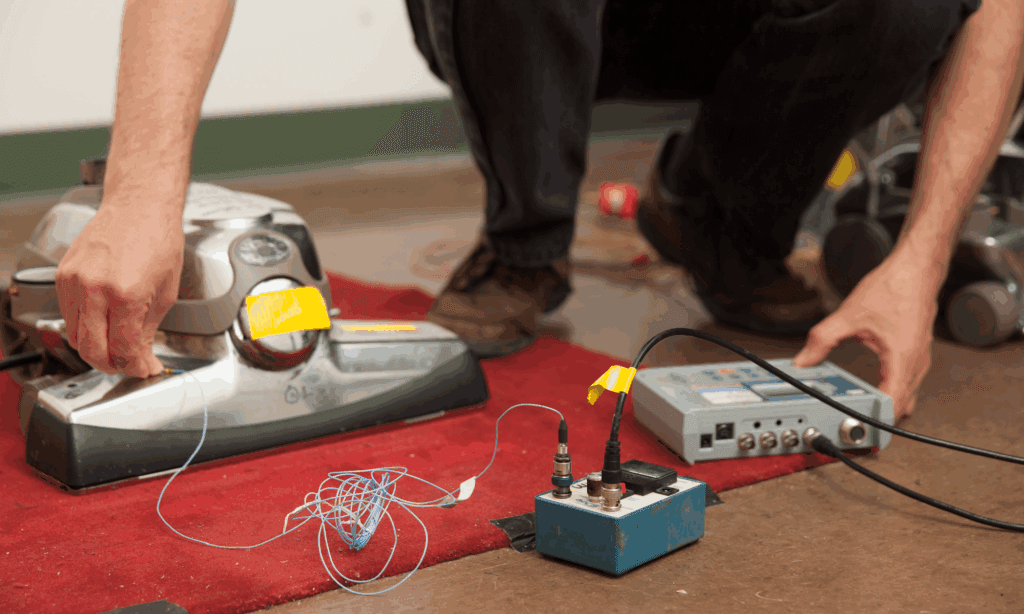
In the vacuum-cleaner case, representative sounds for the four components in Figure 2 were generated through signal processing and by recording each component independently. A dedicated rig allowed the motor to be operated under load, and custom acoustical enclosures isolated airflow sound from the rest of the system. The upper section of Exhibit 1 shows the resulting component sounds.
The Central Composite design specified the variation of these sounds and the number of combinations to present to the jury. It produced a sequence of “what-if” vacuum cleaner sounds created by mixing level-varied versions of the components. After training, jurors listened to each “virtual” vacuum sound over a loudspeaker* and supplied numerical ratings for “Acceptability” and “Perceived Power.” Multiple sequences were presented to span the relevant design space.
*For typical appliances, loudspeaker playback generally preserves spatial characteristics more effectively than headphones.
Jury Study Analysis: Example Process
The attribute ratings from all 25 jurors in our example vacuum cleaner study were first reviewed to determine if there were any jurors who provided no ratings or gave unlikely ratings (such as the same number for all sounds). The ratings were then used as inputs to a response surface analysis configured to utilize multiple linear regressions to build a quadratic model of the relationships between the observed Acceptability and Power ratings and the component sound level changes. Basically, this process tries to fit the entire set of individual juror ratings (around 2,000 observations in total) to a response surface model with all the linear, squared, and two-way interaction terms included. After eliminating a first round of observations with large, standardized residuals (around 4% of the total number of observations) and eliminating statistically insignificant coefficient terms, the analysis was re-run, resulting in response surface models for each attribute.
The regression equations resulting from this reduced-order regression analysis (i.e., the “models”) are summarized below in Figure 3. These models relate the jury-rated values for “Acceptability” and “Perceived Power” to changes in the component sounds from their baseline (i.e., as-recorded) conditions.
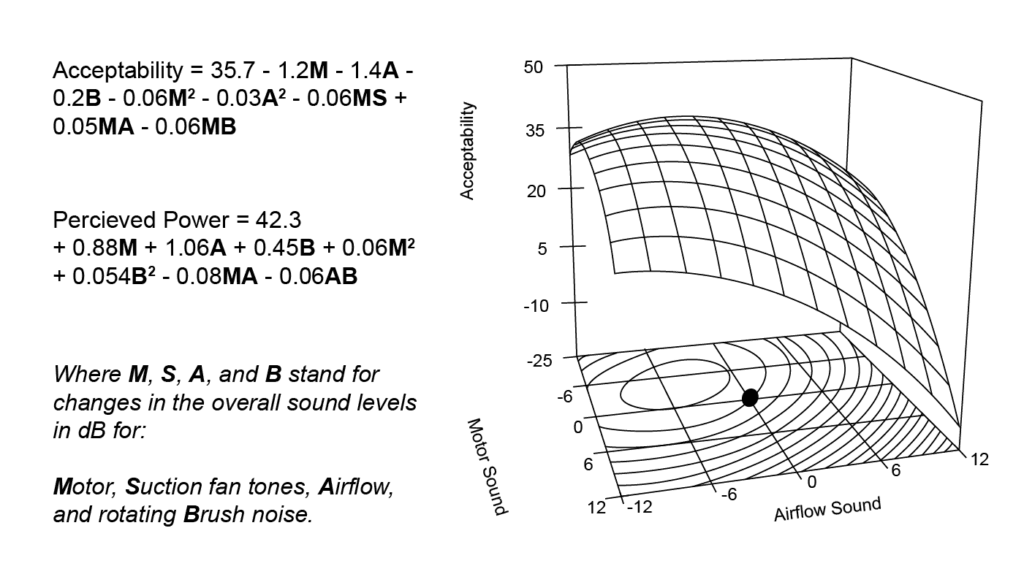
FIGURE 3: REDUCED-ORDER REGRESSION EQUATIONS OBTAINED FOR “ACCEPTABILITY” AND “PERCEIVED POWER” OF AN UPRIGHT VACUUM
The models can then be used to predict the effect on Acceptability and Power based on changes in the various sound-producing components in the vacuum cleaner. In these equations, the current baseline average values for Acceptability and Power are given by the constant term that appears right after the equals sign. Figure 3 also includes an example contour plot similar to that shown in Figure 1( in this case derived from the equation for vacuum noise Acceptability as the motor and airflow sound levels are changed while those for the suction fan tone and the brush are kept constant, i.e. at their original values.
Associated with each of the equations shown in Figure 3 are various statistical indicators arising out of the regression analysis, some of which can be used to help assess the reliability and accuracy of the models. One of these indicators is the regression coefficient, R2, which is the percentage of the observed variability that can be explained by the given model/equation. We have typically seen R2 values in the 40% to 60% range in these types of SQ jury studies that we have conducted on consumer products and other devices such as medical devices, delivery drones and farm equipment. Variability in juror judgments can be fairly large. That does not mean that predictions to changes in component sound levels are wrong, but simply that the design change will not necessarily be universally recognized as beneficial. That is simply a fact of how people perceive sounds. The regression equations themselves are but one tool that can be used to guide subsequent engineering efforts in the pursuit of increasing the end-user’s positive perceptions of the product, as conveyed by its sound.
Using Jury Study Results to Increase Sound Quality & Beyond Jury Studies
In general, regression models such as those shown in Figures 2 and 3 can be used to mock up a few plausible “candidate” or target designs that should improve attribute ratings by similar amounts. These candidate designs are then presented to a jury to determine whether there is a real preference for one design over another, and if so to what degree. The main result from such a “verification study”, usually carried out via forced-choice paired comparisons, will be a preference ranking or “score” of the sounds of the different candidate designs (along with, optionally, the baseline sound of the unaltered design). This information can then be used to assess how close or far apart these designs are to each other in terms of preference based on sound, and to help select a final design for implementation and testing.
Getting back to the vacuum cleaner example, the results shown in Figure 3 indicate that the motor and airflow sounds contribute the strongest to Acceptability and Perceived Power. They also reveal that a higher level of beater brush noise increases Power more than it decreases Acceptability, suggesting a possible route to somewhat increase the perception of power without decreasing Acceptability too much. These results also indicate that the suction fan tone and airflow noise both have a negative correlation with Acceptability, and little effect otherwise, which says that these components can be usefully reduced to improve acceptability without adversely affecting the
perception of power.
FIGURE 4: WIRE MESH MODEL OF VACUUM CLEANER MOTOR SHOWING VIBRATION RESPONSE AT 500 HZ
We explored one way to increase Acceptability while minimizing a decrease in Power by redesigning the vacuum cleaner motor for reduced noise. In a subsequent motor study that we conducted, we found that the radiated motor sound was due mainly to rotating imbalance and electromagnetic interactions between the rotor and stator in 300-2,000 Hz range, and that structural resonances in this frequency range, excited by electromagnetic forces paired between stator and rotor, dominated the vibration response in this range. (Such vibration often leads to the generation of radiated noise).
Figure 4 shows an example of the resonant vibration response of the motor for a mode at 500 Hz. Equivalent imbalance and electromagnetic forces were then determined experimentally by inferring them from operating vibrations and measured transfer functions, which suggested a redesign that incorporated structural stiffening in a manner consistent with the motor mold design. This stiffened design reduced the broadband motor vibration levels by 5 to 10 dB, resulting in lower noise levels for the motor.
It can sometimes be beneficial if physical metrics calculable from the measured sound of a product can be correlated to existing sound quality ratings that have already been obtained for that particular type of product. To do this, a modified form of Principal Components Analysis (PCA) or Partial Least Squares (PLS) can sometimes be harnessed to reduce the many existing sound quality metrics that can be calculated to just a few custom metrics. Usually, these turn out to be weighted combinations of the most “important” metrics as determined by PCA or PLS, which can then be used to relate physical measures of the sound from existing and future products to sound quality as determined by existing jury ratings. This can make it convenient to use the recorded/measured sounds of various potential prototype products to predict subjective reactions to their sounds without necessarily having to conduct further jury studies on different versions.
Design Cycles: Where Sound Quality Fits
Without intentional steps to shape a product’s sound quality, consumer products tend to become louder due to market pressures to use lightweight components to reduce costs or have faster-rotating parts to achieve higher performance. Acentech’s Product Sound team works directly with manufacturers’ representatives from product planning, marketing, engineering design, heat transfer, and other specialty areas to balance these design goals with the implications on sound quality.
Finding the time and budget to engineer an improved product sound is challenging. If you start too early in the design, you are limited in the ability to predict realistic sound characteristics, but too late and you may not be able to change critical components. By incorporating sound quality analysis with noise and vibration control at the right time, you are ensuring the most cost-effective means of product sound design. Once you have conducted one noise audit on a product line, you can use those results to inform future model versions earlier in their design. With these thoughtful design strategies, manufacturers can bring products to market that sound better, thereby enhancing the consumer’s overall product experience.